Site Scorecards
Summary View
This section explains the meaning of the various scorecard charts and demonstrates how you can use this data to enhance your site's overall performance.
- Uptime
- Response Time
- Page Speed Test
- First Contentful Paint
- Largest Contentful Paint
- Cumulative Layout Shift
- Accessibility Audit
- SEO
- Best Practices
Uptime
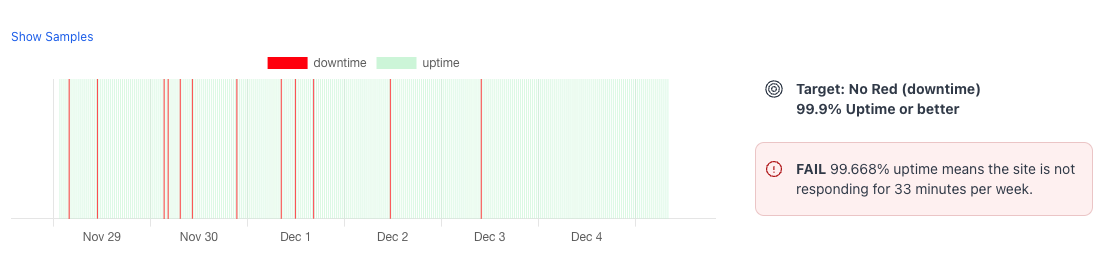
This chart displays the total time your website has been down over a specified date range. Visitors attempting to access your site during downtime will encounter an error message instead. Minimizing downtime is essential for maintaining a strong reputation and improving search engine rankings. On this chart, red indicates downtime (bad), while green represents uptime (good).
Response Time
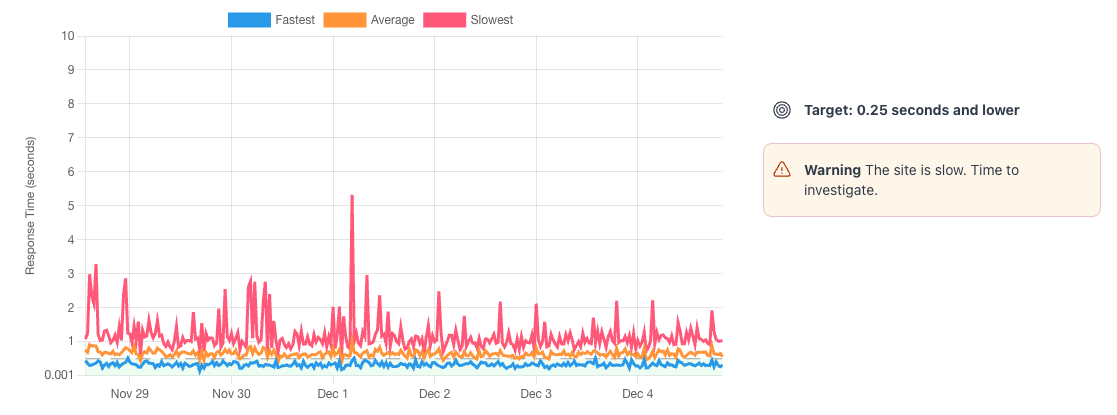
Response time measures how many seconds it takes for a site's page to load in a visitor's browser. The fastest sites achieve this in 0.025 seconds or less, while response times under 0.25 seconds are generally considered good. Spikes on this chart often indicate that your host, platform, or server is experiencing slowdowns. Response times exceeding 1 second should be addressed, as they may point to misconfigurations or inadequate server resources. See View Individual Audits below.
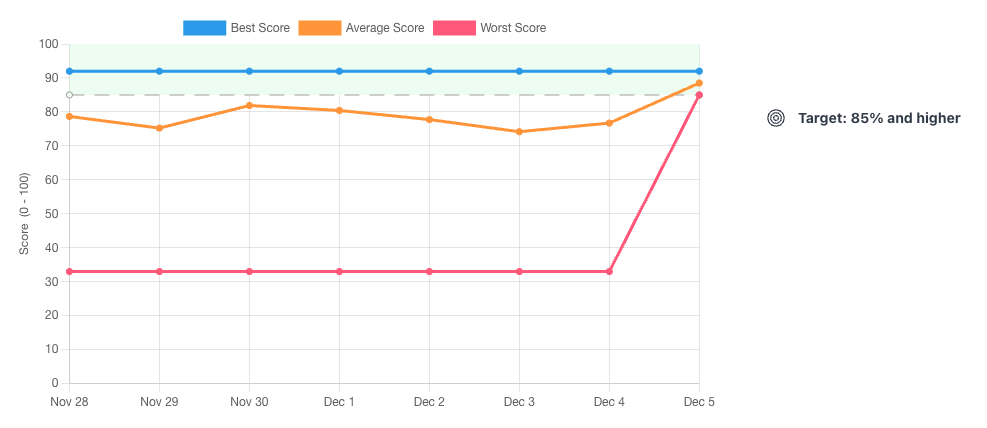
Page Speed Test
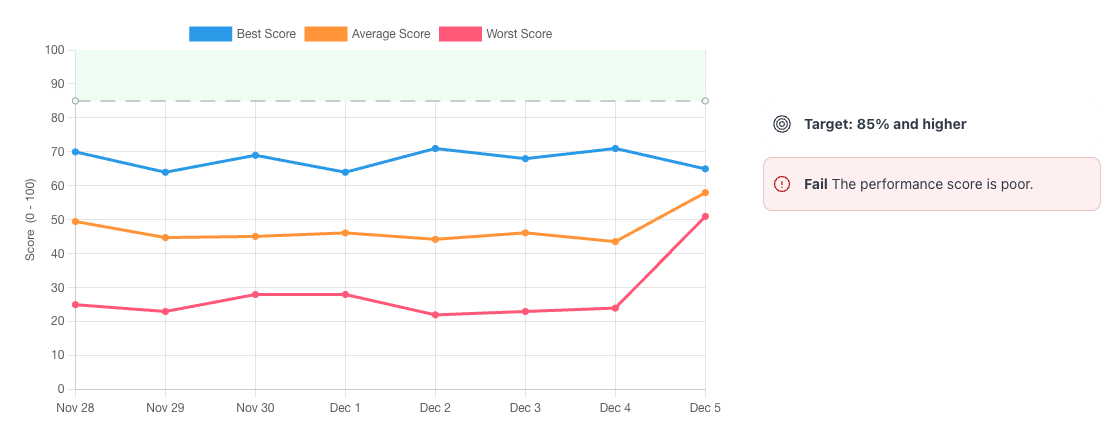
Google's PageSpeed Insights performs a field test of your site to calculate a performance score on a scale of 0 to 100. Scores of 85 or higher are considered good, while scores of 90 or higher are deemed great. This chart displays an aggregation of all the pages currently monitored by ONIK. See View Individual Audits below.
First Contentful Paint
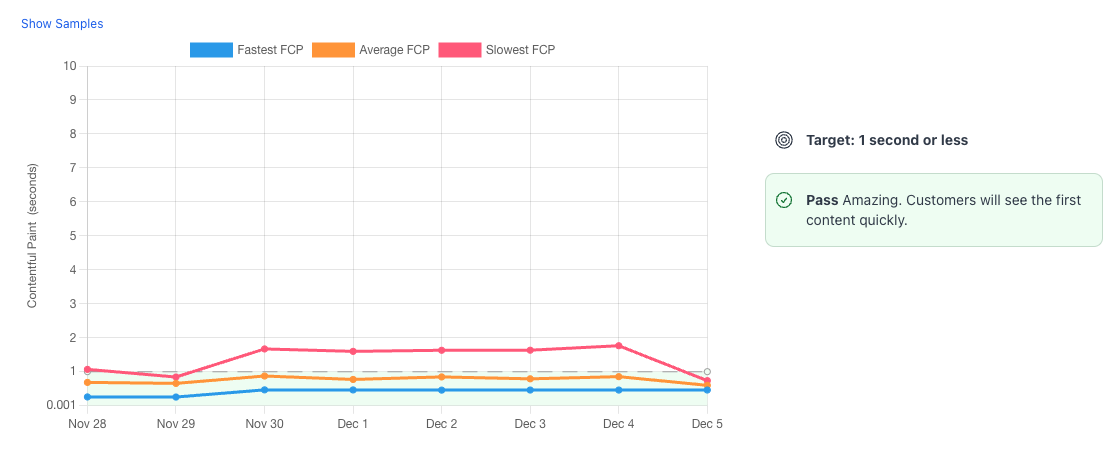
First Contentful Paint (FCP) measures the time from when a page begins loading to when content first appears on the visitor's screen. The goal is an FCP of 1 second or less. If FCP exceeds 2 seconds, the site may feel sluggish and slow to users. This chart displays an aggregation of all the pages currently monitored by ONIK. See View Individual Audits below.
Largest Contentful Paint
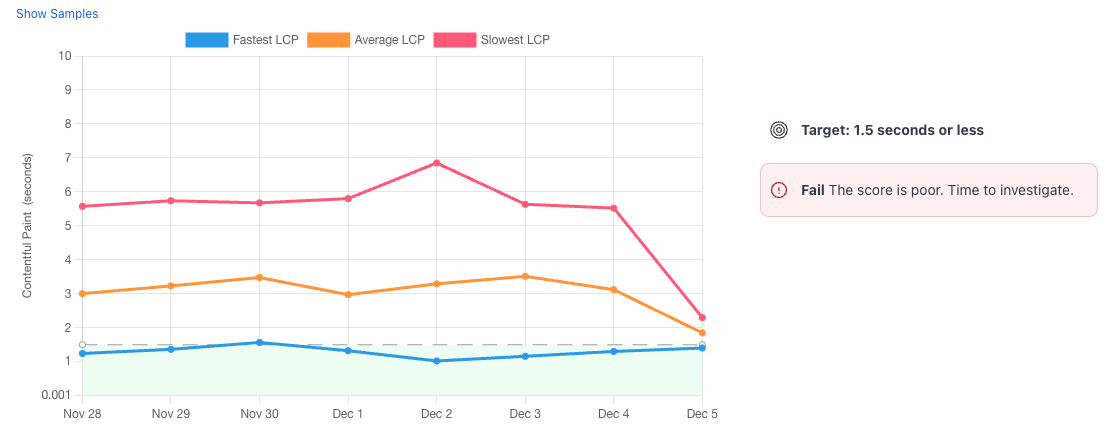
Largest Contentful Paint (LCP) measures the time from when a page begins loading to when the largest piece of content is displayed on the visitor's screen, often an image. A good LCP score is 1.5 seconds or less. If the score exceeds 2.0 seconds, visitors may consider leaving the site. This chart displays an aggregation of all the pages currently monitored by ONIK. See View Individual Audits below.
Cumulative Layout Shift
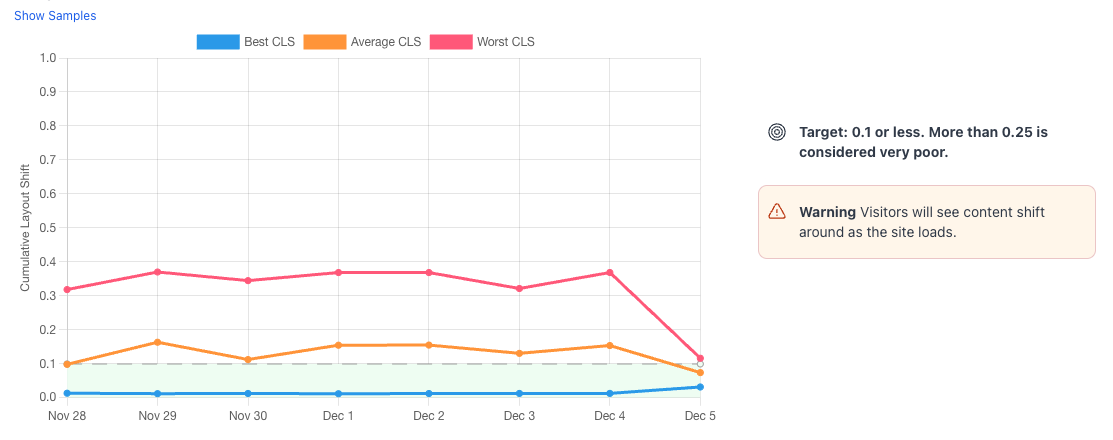
Cumulative Layout Shift (CLS) measures the amount of unexpected layout movement on a page. A good CLS score is 0.1 or less. Scores of 0.25 or higher can frustrate visitors as the page content shifts unexpectedly. This chart displays an aggregation of all the pages currently monitored by ONIK. See View Individual Audits below.
Accessibility Audit
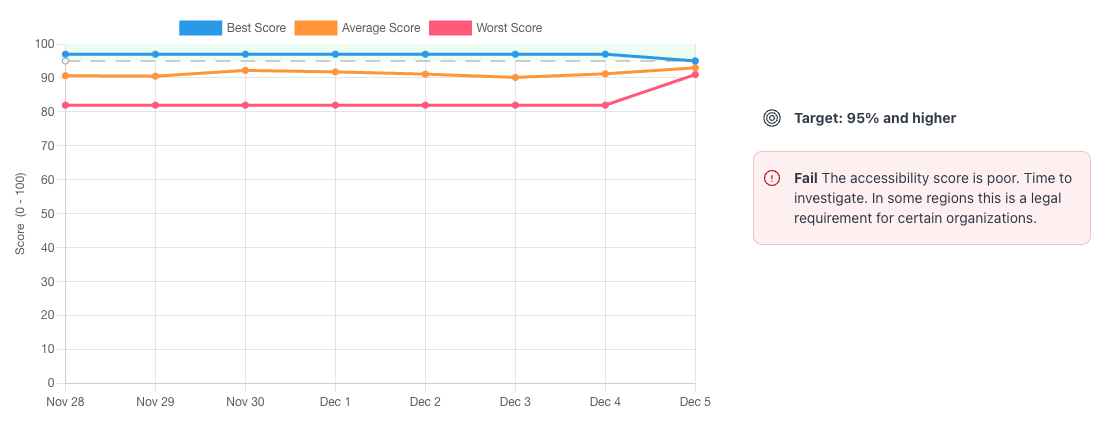
The accessibility audit score assesses how well a web page complies with accessibility best practices, ensuring inclusivity for users with disabilities. It evaluates factors such as proper HTML usage, sufficient color contrast, and compatibility with assistive technologies. WCAG 2.2 Level AA is the recommended standard for most sites. This chart displays an aggregation of all the pages currently monitored by ONIK. See View Individual Audits below.
SEO
The SEO score evaluates the technical aspects of a web page's SEO, focusing on best practices to enhance search engine visibility. It assesses elements such as metadata, structured data, link structure, and technical errors. This chart displays an aggregation of all the pages currently monitored by ONIK.
Best Practices
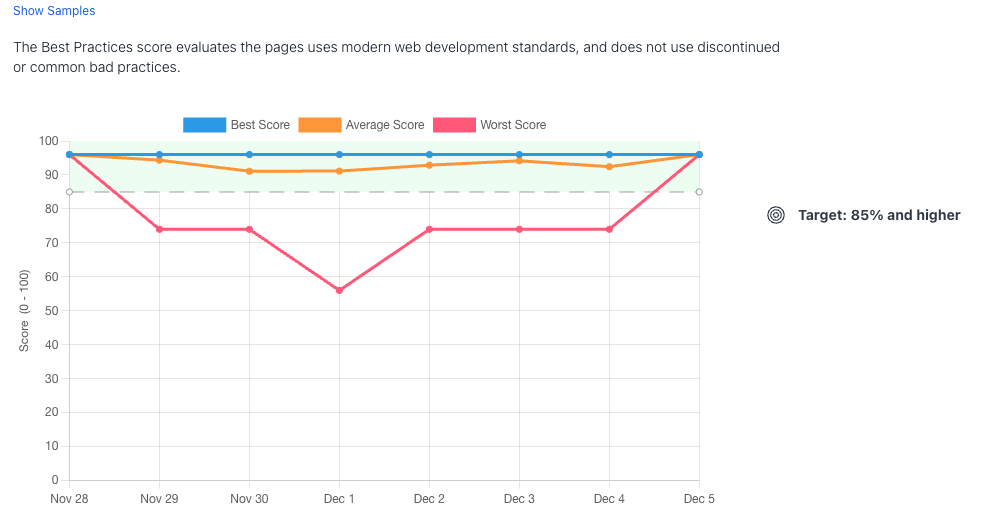
The Best Practices score evaluates whether the page adheres to modern web development standards and avoids outdated or poor practices.
View Individual Audits
In the left menu you will see the below options:
Summary
Clicking on Summary will return you to the main Site page where you can view you data in chart form.
Go back to View Individual Audits
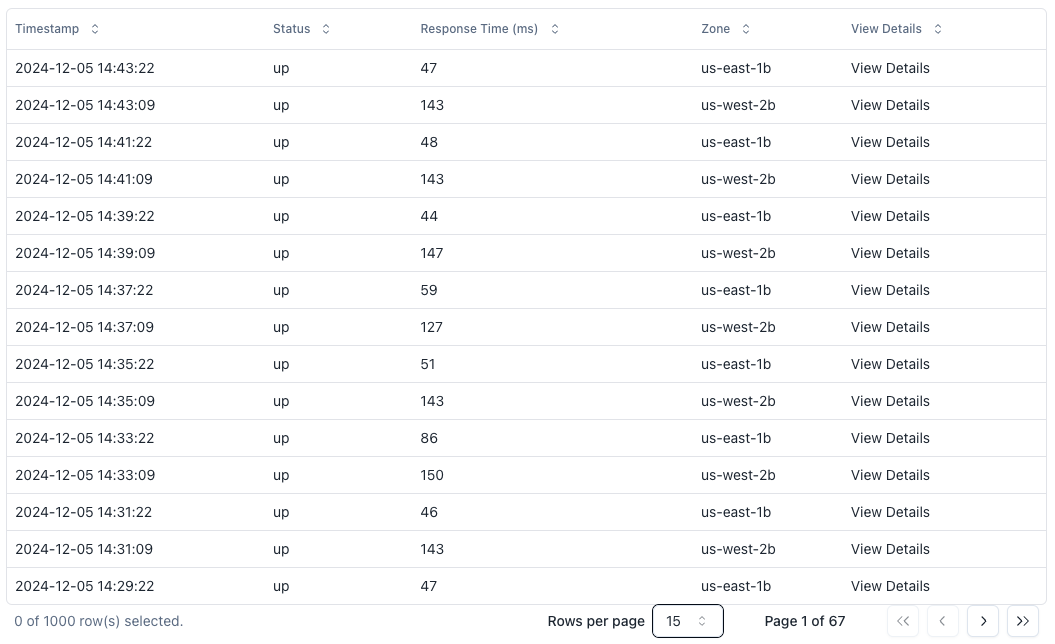
Response
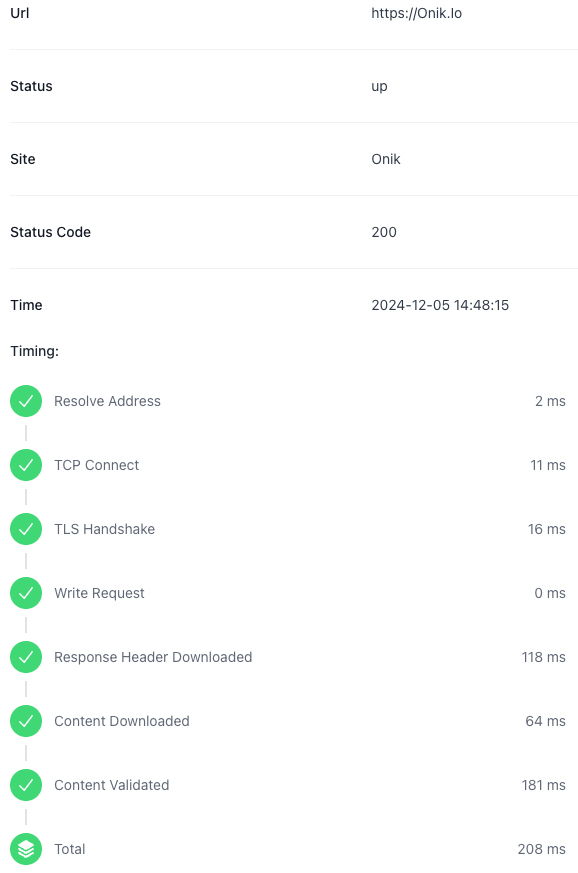
Clicking on Response will open a table with your latest response data. From here you can sort the table by Timestamp, Status, Resposne time (in milliseconds), Zone (aws region tested). You can also click on View Details for a detailed view of the test data.
Go back to View Individual Audits
Performance
Clicking on Performance will open a table view which lists all the pages ONIK is currently monitoring for you. In each row you can see the URL being monitored as well as the most recent audit data for that page.
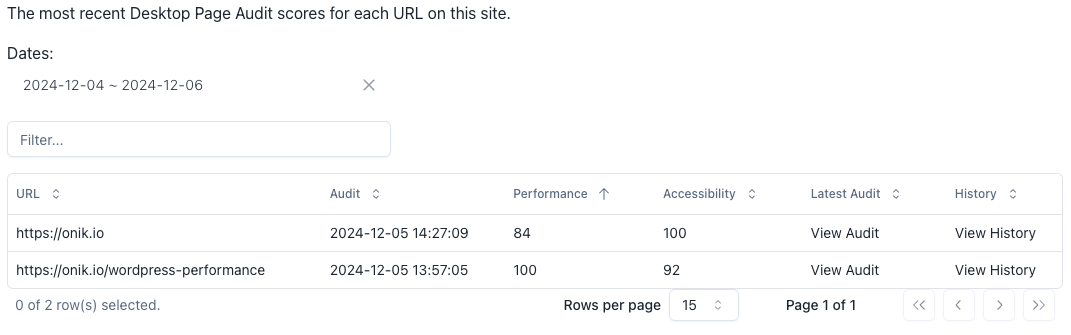
From here you can select to view the detailed view of the most recent audit by clicking on "View Audit" or "View History" which will show you historical audit data of desktop and mobile test completed for the page selected.
Go back to View Individual Audits
Accessibility
Clicking on Accessibility will open a table view which lists all the pages ONIK is currently monitoring for you. In each row you can see the URL being monitored as well as the most recent audit data for that page.
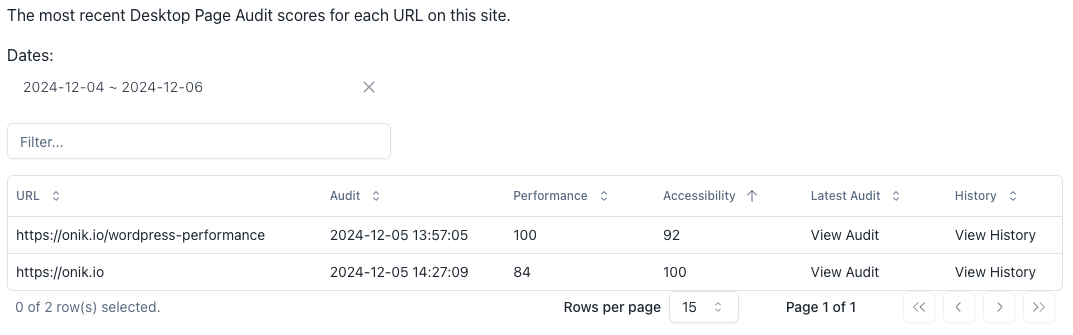
From here you can select to view the detailed view of the most recent audit by clicking on "View Audit" or "View History" which will show you historical audit data of desktop and mobile test completed for the page selected.
Go back to View Individual Audits